Live Gold Chart – Gold Price Graph for Dubai and the UAE
The live gold chart above plots the price of one gram of 24K gold in dirhams, one point per trading day, and adds a new point automatically every evening when the international market closes. The spot board next to it shows the current ounce price in dollars and dirhams with the day's change, so you can see today's move against the longer trend in one glance. This page explains how to read the gold price graph, what the timeframe buttons do, how candlestick and line charts differ, what support and resistance mean, and which events shaped the biggest moves in gold's modern history.
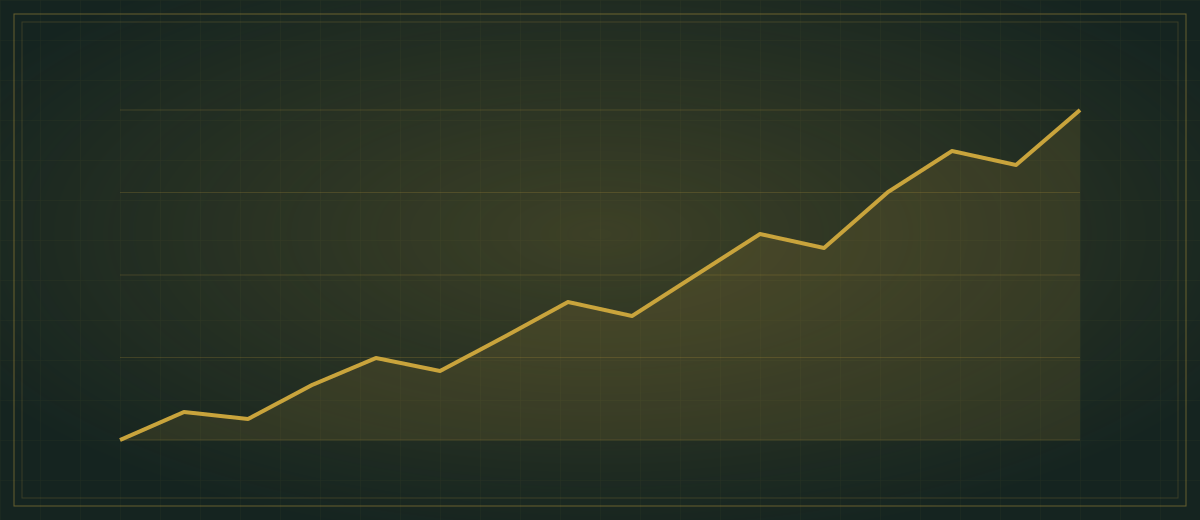
How to read the live gold chart on this page
The line is the daily closing price of a gram of 24K gold converted into dirhams at the fixed peg of 3.6725 to the US dollar. Each point is one day; weekends and market holidays simply do not appear, because the spot market is closed from Friday night in New York until early Monday in Asia. The shaded area under the line has no meaning beyond making the shape easier to see on a phone.
Under the graph you will find three figures for the selected period: the lowest close, the highest close and the percentage change from the first point to the last. These three numbers answer the questions most people come here with. Is gold near its recent high? How much has it moved since I last bought? How wide has the range been?
Because 22K, 21K and 18K are fixed fractions of the 24K rate (91.6%, 87.5% and 75%), the shape of the chart is identical for every karat; only the scale changes. If you want to see the number for the purity you actually buy, the 24K rate page and its sister pages show live figures, and the gold calculator converts any weight. The chart tracks metal value only: a shop receipt will also include making charges and 5% VAT on jewellery.
Timeframes: from one month to the full history
The buttons above the graph switch the window between one month, three months, six months, one year and everything we have on record. Each window is useful for a different question, and experienced readers flick between them rather than settling on one.
| Range | Best for | What to watch |
|---|---|---|
| 1 month | Deciding whether this week is unusually expensive or cheap | Day-to-day noise is large; a single US data release can dominate |
| 3 months | Seeing the direction since the last festival or wedding season | Short trends and pullbacks become visible |
| 6 months | Comparing today's price with what you paid earlier in the year | The default view; balances detail and context |
| 1 year | Judging the broader trend and the seasonal pattern | Diwali, Chinese New Year and Eid demand periods show up |
| All | Perspective: how far gold has travelled since the chart began | Short moves flatten out; the long trend dominates |
A simple habit helps: check the one-month view to see if today is a local high or low, then the one-year view to see whether that local move matters. The UAE gold rate history page goes further, with a month-by-month account of what moved the price.
Line charts and candlestick charts: what the shapes mean
This page uses a line chart because it answers the questions a shopper or saver actually has. Traders often prefer candlesticks, and if you open a gold trading graph on a broker's app you will see them, so it helps to know how to read both.
Line chart
One value per period, usually the close, joined by a line. Clean, easy to compare across timeframes, and it hides the intraday swings that do not matter for someone buying a bangle or a 10-gram bar.
Candlestick chart
Each period becomes a candle with four prices: open, close, high and low. The body runs from open to close, coloured one way if the close was higher (often green) and another if it was lower (often red). The thin wicks reach to the high and low. A long wick with a small body shows that the price travelled far but came back, a sign of indecision; a long body shows a decisive session.
Volume and indicators
Under a trading chart you may see volume bars, which show how much was traded, and overlays such as moving averages, which smooth the price over a chosen number of days. A 24-hour gold chart on a broker platform is usually built from 5-minute or 15-minute candles and is a tool for traders; for the price of jewellery, the daily close is all you need.
Support, resistance and trend: the vocabulary without the advice
When people discuss a gold trend chart they use a handful of terms that sound technical but describe simple shapes. Knowing them lets you follow market commentary without being swayed by it.
- Trend: a sequence of higher highs and higher lows (uptrend) or lower highs and lower lows (downtrend). Sideways movement between two levels is called a range.
- Support: a price area where falls have repeatedly stopped, because buyers stepped in. On a gram-in-dirhams chart it often sits at a round number that jewellers and shoppers remember.
- Resistance: the mirror image, a level where rises have stalled as sellers took profits.
- Breakout: a move through support or resistance, which commentators treat as a signal that the range has ended.
- Moving average: the average close over the last 50 or 200 days, used to describe whether the price is "above trend" or "below trend".
None of these lines predicts anything reliably. They are descriptions of where the price has been, drawn after the event, and two analysts will often draw them in different places. They are worth knowing because a souk salesman, a WhatsApp group or a finance channel may use them to argue that now is the moment to buy; the chart itself makes no such promise. Our gold price analysis page covers the economic forces behind the lines.
What moved gold in the big eras of the modern chart
Zoom any long-term gold price history graph out to fifty years and a few turning points stand out. They are worth knowing because they explain why gold is held the way it is in the Gulf, and because the same forces keep returning in new forms.
The 1970s: the end of the gold standard
Until 1971 the US dollar was convertible to gold at a fixed official price. When that link was cut, gold began to float freely, and the inflation and oil shocks of the decade sent it to levels that would have seemed impossible a few years earlier. The modern market, and the modern chart, begins here.
The long quiet and the 2000s revival
After a peak in 1980 gold drifted for two decades while equities boomed. The 2008 financial crisis changed the mood: investors wanted an asset outside the banking system, and central banks that had been selling turned into buyers.
The 2011 peak and the pandemic
Gold set a record in 2011 after years of crisis spending and low rates, then fell back as the US economy recovered. The 2020 pandemic brought emergency rate cuts and a new record as savers everywhere, including many UAE households, looked for safety.
The 2020s: central banks and the Gulf
Through the 2020s, central banks in emerging markets became consistent buyers, and demand from China, India and the Gulf stayed strong. These descriptions are deliberately broad; exact figures belong on the live board, not in a text that would date.
The 24-hour gold chart and the market trend today in Dubai time
The daily chart hides what happens inside a day, and inside a day is where the "gold market trend today" is decided. The international market opens in Asia in the small hours of Monday Dubai time and runs almost without a break until early Saturday morning. Within each day, three windows matter most for the UAE reader.
Late morning, London comes online and volume rises; the morning LBMA auction prints shortly after. Late afternoon, roughly 16:30–17:30 Dubai time depending on US daylight saving, New York opens and American economic data is released; this is when the spot price in dollars most often jumps. Late evening, the US session winds down and the day's close is recorded, which becomes the next point on our chart.
For a shopper this has a practical meaning. The rate the Dubai Gold & Jewellery Group displays in the morning reflects the Asian session; the rate in the evening can already include the US move. If you are buying a large piece and the chart has been volatile, checking the board again before paying is a sensible habit. The change figure on the spot board compares the live price with the previous close, so a glance tells you whether today is running above or below yesterday.
Other gold chart tools people use, and what each is for
Searches like "Kitco gold chart last 3 days" or "gold TradingView" show that many UAE readers already use specialist sites, and there is nothing wrong with that. Each tool has a purpose, and this page is designed to sit alongside them rather than replace them.
- Kitco is a long-established precious-metals news and data site. Its short-term charts, including a rolling three-day view, overlay several trading days in different colours so you can compare the shape of each session.
- TradingView is a charting platform used by traders. It offers candlesticks, dozens of indicators, drawing tools for support and resistance, and the XAU/USD pair in many timeframes down to one minute.
- Broker apps that offer online gold trading in Dubai include their own charts, usually candlesticks on the contract you are trading, with the broker's own bid and ask rather than a neutral midpoint.
- This page shows the thing none of those do directly: the price of a gram in dirhams, by karat, day by day, with the UAE buyer in mind.
A useful rule is to match the tool to the decision. Use a professional platform if you trade; use the gram-in-AED chart if you buy jewellery, bars or coins and want to know whether this month is expensive compared with the last year.
Using the gold price graph as a UAE shopper or saver
Most people in the UAE who look at a gold chart are not traders. They are planning a wedding set, deciding whether to buy a gold bar this month or next, or wondering whether to sell a bangle before a trip home. For those decisions the chart is a context tool, not a crystal ball.
Three honest uses stand out. First, perspective: if the one-year view shows today near the top of its range, you know that any purchase is being made at a relatively high price, and you can weigh that against how much you need the item. Second, budgeting: combine the chart with the calculator to see what 10 grams would have cost three months ago and what it costs now. Third, selling: a buyer's offer should sit a predictable margin below the current rate, so a glance at the chart tells you whether an offer is fair or whether the buyer is quoting last week's price.
Prices on this page are indicative, drawn from live market data, and may differ slightly from a shop's displayed rate. Nothing here is advice to buy or sell; gold can fall as well as rise, and the best time to buy jewellery is usually when you need it.
For today's gram rates by karat across all seven emirates, return to the gold rate in Dubai today page.
Frequently asked questions
What does the live gold chart on this page show?
It plots the daily closing price of one gram of 24K gold in dirhams, converted from the international spot price at the fixed dollar peg. A new point is added automatically each evening after the US market closes. Use the range buttons to view one month, three months, six months, a year or the full record.
Why does the chart not show weekends?
The international gold market is closed from Friday evening in New York until early Monday in Asia, so there is no close to record on Saturday or Sunday. The chart joins Friday's point to Monday's. UAE shops still display Friday's rate over the weekend until trading resumes.
Is the gold price chart the same for 22K and 21K?
The shape is identical, because 22K is always 91.6% of the 24K rate and 21K is 87.5%. Only the scale on the vertical axis changes. A 2% rise in 24K is a 2% rise in every karat, so one chart serves all purities; the karat pages show the live number for each.
What is the difference between a line chart and a candlestick gold chart?
A line chart joins one price per period, usually the close, and is easiest to read. A candlestick chart shows four prices per period: open, close, high and low, with a coloured body and thin wicks. Traders use candles to see intraday swings; shoppers rarely need more than the daily line.
Can the chart tell me whether gold will go up or down?
No. A chart describes where the price has been; it cannot know where it will go. Terms like support and resistance are labels for past turning points. Treat the chart as context for your budget and timing, not as a forecast, and remember that gold can fall as well as rise.
Keep reading
-
Gold Rate History in the UAE – Dubai Gold Price Chart for the Last 6 Months and Beyond
Historical gold rate in the UAE on one chart: the Dubai gold price per gram over the last month, 6 months and years, how to read it and when to buy.
-
 Gold Spot Price in USD per Ounce – World Gold Price Live from Dubai
Live gold spot price in US dollars per troy ounce, explained from Dubai: what spot means, LBMA fix vs COMEX futures, trading hours and the AED gram rate.
-
 Gold Price Analysis: What Moves the Gold Market, Explained for the UAE
Gold price analysis for the UAE: real interest rates, the dollar, inflation, central banks, ETF flows, jewellery seasons, geopolitics and weekend pricing.
-
 24K Gold Rate Today in Dubai & UAE – 24 Carat Gold Price per Gram, Bars and Coins
Live 24K gold rate today in Dubai and the UAE per gram, 10 g, tola and ounce: 999 purity, bar and coin premiums, VAT zero-rating, 999 bangles and storage.
-
 Gold Calculator UAE – Price of 1 g, 5 g, 10 g, 20 g, 50 g, 100 g, 1 Tola and 1 kg Today
Gold calculator for the UAE: today's price for 1 g, 5 g, 10 g, 20 g, 50 g, 100 g, 1 tola and 1 kg in 24K, 22K, 21K and 18K, with making charges and VAT.
-
 Gold Trading Online in Dubai – DGCX, CFDs, Gold Accounts and Digital Gold Explained
How gold trading online works from Dubai: DGCX futures, broker CFDs under SCA or DFSA rules, bank gold accounts, digital gold apps, spreads and leverage.
-
 Gold Rate in Abu Dhabi Today – 24K, 22K and 21K per Gram
Today's gold rate in Abu Dhabi, live for 24K, 22K, 21K and 18K per gram in AED, plus where to buy at Madinat Zayed Gold Centre, Hamdan Street and malls.
-
 Gold Rate in Al Ain Today – Live Price per Gram and Where to Buy
Today's gold rate in Al Ain per gram for 24K, 22K and 21K, plus a local guide to the Al Ain gold souk, Al Ain Mall and Bawadi Mall jewellers and Buraimi.