Gold Rate History in the UAE – Dubai Gold Price Chart for the Last 6 Months and Beyond
This page keeps the historical gold rate for the UAE in one place. The chart above plots the Dubai gold price per gram in dirhams for the last month, the last 6 months and longer, with a karat switch so you can follow 24K, 22K, 21K or 18K. Below it you will find a plain explanation of how to read the graph, what has pushed gold up and down in recent years, how UAE residents use the history to time jewellery purchases, and why the same week every year tends to be busy in the souk.
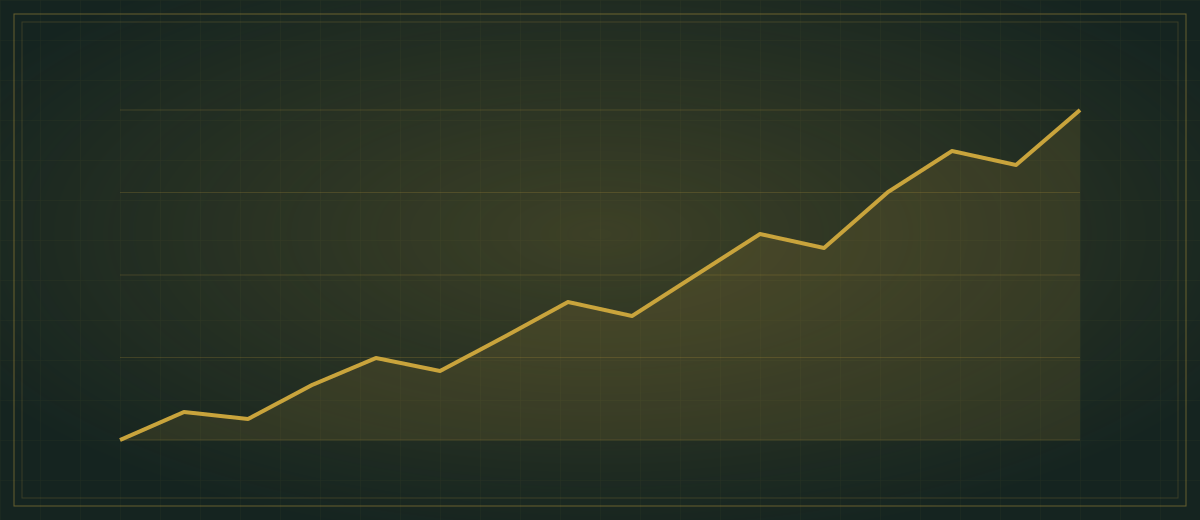
How to read the Dubai gold price chart
The line shows the closing price of one gram of gold on each day, converted into dirhams at the fixed peg of 3.6725 to the dollar. Use the range buttons to switch between one month, six months, one year and the full history; the longer the window, the more the daily noise flattens out and the trend becomes visible. Hover or tap a point to see the exact rate for that date, and switch the karat tab to see how the same movement looks for the purity you actually buy.
Three things are worth knowing before you draw conclusions. First, the chart tracks the metal value only, so the price you paid in a shop was higher once making charges and 5% VAT were added. Second, weekends show a flat line because the international market is closed from Friday evening in New York until Monday morning in Asia. Third, the karat lines never cross: 22K is always 91.6% of the 24K rate, 21K is 87.5% and 18K is 75%, so a percentage move is identical across all of them.
If you want to see the live picture rather than the history, the today's gold rate page shows the current board and the live chart updates through the trading day.
Gold rate in the last 6 months in the UAE: what the graph is telling you
Gold price history
History is collected daily; the chart fills in as data arrives.
- min
- …
- max
- …
- %
- …
Daily closing prices per gram in AED for the selected karat. The history grows automatically every day.
Six months is the window most UAE residents care about, because it covers the gap between two trips home or between a salary-saving plan and a wedding. When you look at it, ignore the exact numbers for a moment and look at the shape. A line that climbs in steps with short pullbacks tells you buyers have been stepping in on every dip; a line that drifts sideways in a band tells you the market is waiting for news; a sharp spike followed by a fade is usually a reaction to a single headline.
Compare the highest and lowest points of the window. The gap between them, divided by the current price, is the range you have been living in. For a 10-gram chain that gap, multiplied by ten, is the most you could have saved or lost by picking a different day in the period. In most six-month windows that figure is smaller than the difference in making charges between two shops on the same street, which is a useful perspective when you are tempted to wait for a lower rate.
Write down the gram rate on the day you start saving, then check this chart against it. If gold has risen, your dirhams buy fewer grams; if it has fallen, you can buy a little more. Either way the gold calculator converts the current rate into the weight you are planning.
Gold rate in Dubai last month compared with last year
The one-month view is where most of the drama lives. Within a single month the price reacts to US employment data, inflation prints, central-bank meetings and whatever is happening in the Middle East or Eastern Europe. Day-to-day swings of a percent or two are normal and do not by themselves mean anything has changed. Jewellers in Deira and Meena Bazaar see the same chart you do, and they rarely adjust making charges because of a one-week move.
Stretch the window to a year and the picture calms down. Gold tends to move in long phases, several months of rising followed by several months of consolidation, and a yearly view shows which phase you are in. It also lets you see the seasonal rhythm described further down: the autumn climb into Diwali and the winter wedding season, the quieter summer, the pre-Eid demand.
Ten-year perspective
The gold price over the last 10 years is best read in dollars, because the dirham peg means the AED chart is simply the USD chart multiplied by 3.6725. Over a decade, gold has moved through periods of strong gains and periods of flat or falling prices; it has never been a straight line. Residents who treat it as savings rather than a trade generally found that buying regularly through those phases mattered more than catching a single low. That is an observation about history, not a forecast.
What moved the gold price in recent years
Four forces explain most of the movement you see on the long-range chart, and they tend to arrive together.
- Central-bank buying. Many central banks, particularly in emerging economies, have added gold to their reserves in recent years as a way to diversify away from the dollar. Their purchases are large, steady and price-insensitive, which creates a floor under the market during sell-offs.
- Inflation and real interest rates. Gold pays no interest, so it competes with bonds. When inflation runs above interest rates, holding cash loses value and gold becomes attractive; when central banks raise rates faster than inflation, gold often stalls because a bank deposit suddenly pays more.
- The US dollar. Gold is priced in dollars, so a weaker dollar lifts the gold price for everyone else, and a stronger dollar pushes it down. Because the dirham is pegged, UAE residents feel these moves exactly as an American buyer would.
- Geopolitics and crises. Wars, sanctions, banking scares and election uncertainty send money into gold quickly. Those spikes are often partly reversed once the news settles, which is why the one-month chart can look frightening while the one-year chart looks calm.
The gold price analysis page goes deeper into each driver and how to follow them week by week. For the purposes of a jewellery budget, the takeaway is simple: the gram rate in Dubai is set by global events, not by local demand, and no shop can offer you a lower metal price than the board.
How UAE residents use price history to time jewellery purchases
Nobody can predict the next move, but history can still make you a smarter buyer. Here is how experienced shoppers in the Emirates actually use it.
- Set a target range, not a target price. Look at the six-month low and high. If today's rate sits in the lower third of that range, many buyers decide it is a reasonable day; if it sits near the top after a sharp run, they wait a week or two unless the piece is needed for a fixed date.
- Buy weight, not timing. For a bridal set that must be ready for a date, it is safer to buy in two or three instalments over a couple of months than to bet everything on one dip. Most Dubai jewellers will hold a design on deposit and lock the rate on the day you pay for each portion.
- Negotiate the part you can control. The metal rate is public and identical everywhere; making charges are not. A quiet week on the chart is also a quiet week in the souk, which is exactly when labour charges are easiest to negotiate.
- Keep the receipt and note the rate. When you later want to sell gold in Dubai, the chart tells you instantly whether you are selling above or below your purchase rate, and the receipt proves the karat.
Remember that the price on a receipt includes labour and VAT. Comparing it with the metal-only chart will always make it look as if you overpaid; strip out the making charges first to see the true metal comparison.
Seasonality: wedding season, Diwali, Eid and the Dubai Shopping Festival
Seasonality in the UAE does not change the gram rate, which follows the world market, but it changes everything else about the buying experience: stock, queues, making charges and the room to bargain. Knowing the calendar is often worth more than knowing the chart.
| Period | Who is buying | What it means for you |
|---|---|---|
| Diwali and Dhanteras (October–November) | Indian families buying coins, bars and jewellery for the festival | Busiest weeks of the year in Deira and Karama; new collections launch, discounts on making charges, but less room to negotiate |
| Winter wedding season (November–February) | South Asian and Arab families buying bridal sets | Heavy 21K and 22K sets sell fast; order early, expect firm labour charges on intricate work |
| Dubai Shopping Festival (December–January) | Tourists and residents chasing promotions | Gold promotions, raffles and reduced making charges; a good moment for plain chains and bangles |
| Ramadan and Eid al-Fitr, Eid al-Adha | Gulf and Arab families buying gifts and 21K sets | Pre-Eid rush in the last ten days; shops extend evening hours |
| Summer (June–August) | Fewer tourists, many residents away | Quietest season; summer promotions and the easiest time to bargain on labour |
Notice that the two quietest windows, mid-summer and the weeks right after Diwali, coincide with the easiest negotiations. If the chart happens to be in a calm phase at the same time, the combination of a steady metal rate and soft making charges is as close to a good deal as gold jewellery gets.
History is not a forecast: using the chart sensibly
A long rising line makes people confident and a sharp drop makes them panic, and both reactions have cost UAE buyers money. The honest reading of any gold chart is that it shows what has already happened. Gold can fall for years as well as rise for years, and the dirham peg means there is no currency cushion for residents; what the world market does, your gram rate does.
For jewellery, the sensible rule most families settle on is to buy when they need it and to negotiate hard on labour. For savings, many residents prefer bars or coins because the metal value is not diluted by making charges; the gold bars price page shows how a bar's premium compares to a bangle's labour charge. Whatever you buy, treat the history here as context, keep an eye on VAT rules if you are a visitor who can reclaim it, and remember that every figure on this site is indicative and not advice.
Frequently asked questions
Where can I see the gold rate in Dubai for the last month?
Use the chart at the top of this page and select the one-month range. It shows the daily closing rate per gram in dirhams for the karat you choose, with the exact value for each date when you tap a point. The same chart extends to six months, one year and the full history.
Is the gold rate history the same for Dubai, Abu Dhabi and Sharjah?
Yes. The daily retail rate published by the Dubai Gold & Jewellery Group is used across all seven emirates, so a single chart covers the whole country. Only making charges and the choice of designs vary between Abu Dhabi, Sharjah, Ajman and Dubai, and those are not part of the gram rate.
Why does the AED chart look exactly like the USD chart?
Because the dirham has been pegged to the dollar at 3.6725 since 1997. The UAE gram price is the international dollar price per ounce divided by 31.1035 and multiplied by the peg, so every percentage move is identical in both currencies. Residents paid in dirhams therefore feel global gold moves in full.
Does the chart show the price I would pay in a shop?
No, it shows the metal value only. A shop adds making charges for labour and 5% VAT on jewellery, and when you sell, the offer sits slightly below the board rate. Use the chart to track the metal, then add the shop's labour charge and VAT with the calculator to estimate a final bill.
Is there a best month to buy gold in the UAE?
There is no month with a reliably lower gram rate, because the rate follows world markets. There are months with softer making charges and more negotiating room: mid-summer and the Dubai Shopping Festival are the usual examples, while the weeks before Diwali, Eid and the winter wedding season are the busiest and least flexible.
How far back does the gold price history on this site go?
The chart stores daily closes and grows a little every evening, so the full-history view lengthens over time. For a ten-year perspective, read the dollar chart, since the dirham figures are the same line scaled by the peg; the long view shows alternating phases of gains and consolidation rather than a steady climb.
Keep reading
-
Live Gold Chart – Gold Price Graph for Dubai and the UAE
Live gold chart for the UAE: read the gold price graph by timeframe, understand candles, support and resistance, and see what moved gold in past eras.
-
 Gold Calculator UAE – Price of 1 g, 5 g, 10 g, 20 g, 50 g, 100 g, 1 Tola and 1 kg Today
Gold calculator for the UAE: today's price for 1 g, 5 g, 10 g, 20 g, 50 g, 100 g, 1 tola and 1 kg in 24K, 22K, 21K and 18K, with making charges and VAT.
-
 Gold Price Analysis: What Moves the Gold Market, Explained for the UAE
Gold price analysis for the UAE: real interest rates, the dollar, inflation, central banks, ETF flows, jewellery seasons, geopolitics and weekend pricing.
-
 22K Gold Rate Today in UAE – 22 Carat Gold Price in Dubai per Gram, 10 g and Tola
Live 22K gold rate today in UAE and Dubai per gram, 10 g and tola in AED and USD: what 916 means, making charges, buying vs selling rate, hallmark checks.
-
 Gold Making Charges in Dubai – How They Are Calculated and How to Negotiate
Gold making charges in Dubai explained: per-gram vs percentage, typical ranges, what zero making charges really mean, how to negotiate and worked examples.
-
 Gold Bar Price in Dubai Today – 1 g to 1 kg Bars and Biscuits
Live gold bar price in Dubai for 1 g, 10 g, 100 g, tola and 1 kg bars: premiums over spot, zero VAT on 24K bars, PAMP and Emirates Gold, where to buy.
-
 Gold Rate in Abu Dhabi Today – 24K, 22K and 21K per Gram
Today's gold rate in Abu Dhabi, live for 24K, 22K, 21K and 18K per gram in AED, plus where to buy at Madinat Zayed Gold Centre, Hamdan Street and malls.
-
 Gold Rate in Al Ain Today – Live Price per Gram and Where to Buy
Today's gold rate in Al Ain per gram for 24K, 22K and 21K, plus a local guide to the Al Ain gold souk, Al Ain Mall and Bawadi Mall jewellers and Buraimi.